
cgl tier-1 data interpretation Fastest Fast
Question-1 cgl tier-1 data interpretation
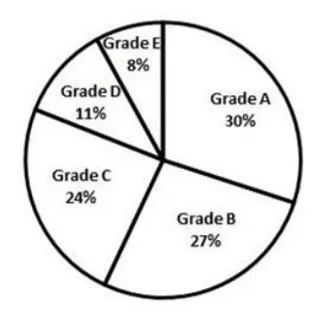
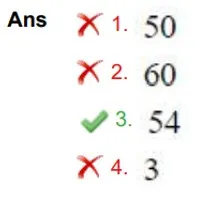
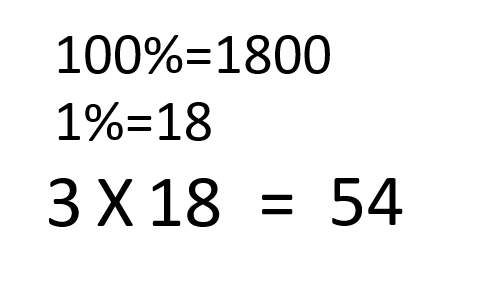
Performance of 1800 students in grades has been shown in the following pie chart. How many more students have obtained grade B than those who have obtained grade C?
ग्रेड में 1800 छात्रों का प्रदर्शन निम्नलिखित पाई चार्ट में दिखाया गया है। ग्रेड C प्राप्त करने वालों की तुलना में कितने अधिक छात्रों ने ग्रेड B प्राप्त किया है?
SSC Cgl Tier-1 held on 20-4-22 Shift-1
Question-2 cgl tier-1 data interpretation
Study the given bar graph and answer the question that follows. The bar graph shows the exports of cars of type A and B (in ₹ millions) from 2014 to 2018
दिए गए दंड आलेख का अध्ययन कीजिए और दिए गए प्रश्नों के उत्तर दीजिए। बार ग्राफ 2014 से 2018 तक A और B प्रकार की कारों के निर्यात (₹ करोड़ में) को दर्शाता है
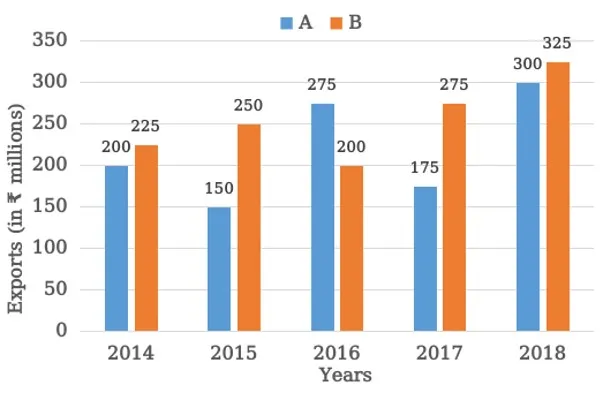
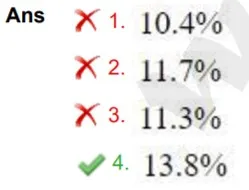
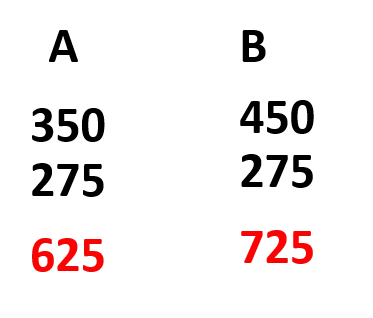
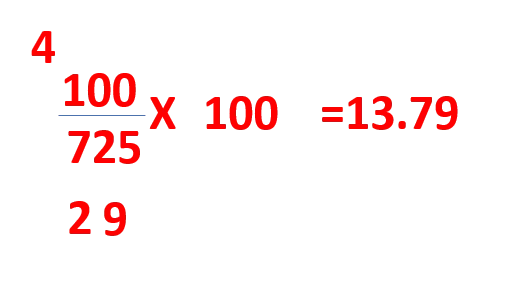
The total exports of cars of type A from 2014 to 2016 is approximately what percentage less than the total exports of cars of type B from 2015 to 2017 (correct to one decimal place)?
2014 से 2016 तक A प्रकार की कारों का कुल निर्यात 2015 से 2017 तक B प्रकार की कारों के कुल निर्यात (एक दशमलव स्थान तक) से लगभग कितने प्रतिशत कम है?
SSC Cgl Tier-1 held on 20-4-22 Shift-1
Question-3 cgl tier-1 data interpretation
Pie-Chart presenting the information about the percentage distribution of a certain corporate office employees by their ages.
पाई-चार्ट एक निश्चित कॉर्पोरेट कार्यालय के कर्मचारियों को उनकी आयु के अनुसार प्रतिशत वितरण के बारे में जानकारी प्रस्तुत करता है।
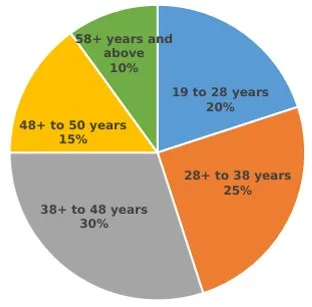
The number of the corporate office employees of age group of 38+ years and above is how much percentage more than that of 28+ to 38 years?
38+ वर्ष और उससे अधिक आयु वर्ग के कॉर्पोरेट कार्यालय के कर्मचारियों की संख्या 28+ से 38 वर्ष की आयु से कितना प्रतिशत अधिक है?

SSC Cgl Tier-1 held on 20-4-22 Shift-1
Question-4 cgl tier-1 data interpretation
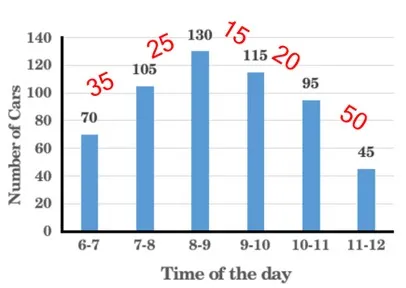
The number of cars passing the road near a colony from 6 am to 12 noon has been shown in the following histogram.
एक कालोनी के निकट प्रातः 6 बजे से दोपहर 12 बजे तक सड़क से गुजरने वाली कारों की संख्या को निम्नलिखित आयतचित्र में दर्शाया गया है।
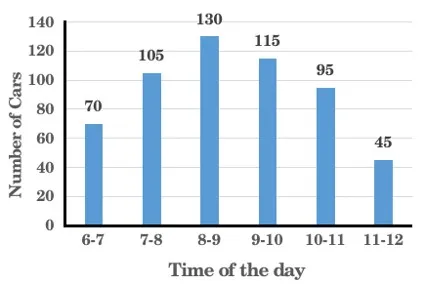
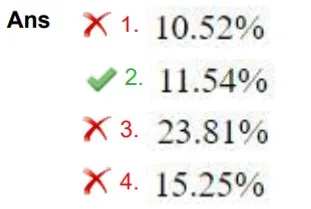
What is the minimum change percentage in the number of cars in comparison to the previous hour? (correct to 2 decimal places)
पिछले घंटे की तुलना में कारों की संख्या में न्यूनतम परिवर्तन प्रतिशत क्या है? (दो दशमलव स्थानों तक)
SSC Cgl Tier-1 held on 20-4-22 Shift-1
Question-5 cgl tier-1 data interpretation
The given bar chart represents the number of Televisions Sets (TV) manufactured (in thousands) and the respective percentage of those TV Sets sold by five different companies A, B, C, D, E
दिया गया बार चार्ट निर्मित टेलीविजन सेटों (टीवी) की संख्या (हजारों में) और पांच अलग-अलग कंपनियों A, B, C, D, E द्वारा बेचे गए उन टीवी सेटों का संबंधित प्रतिशत दर्शाता है।
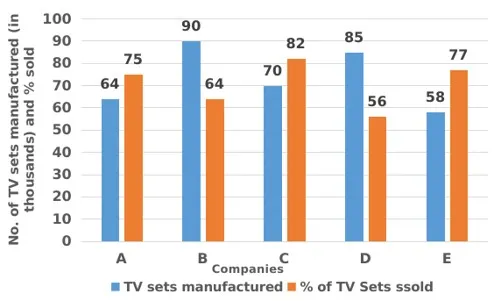
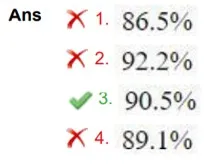
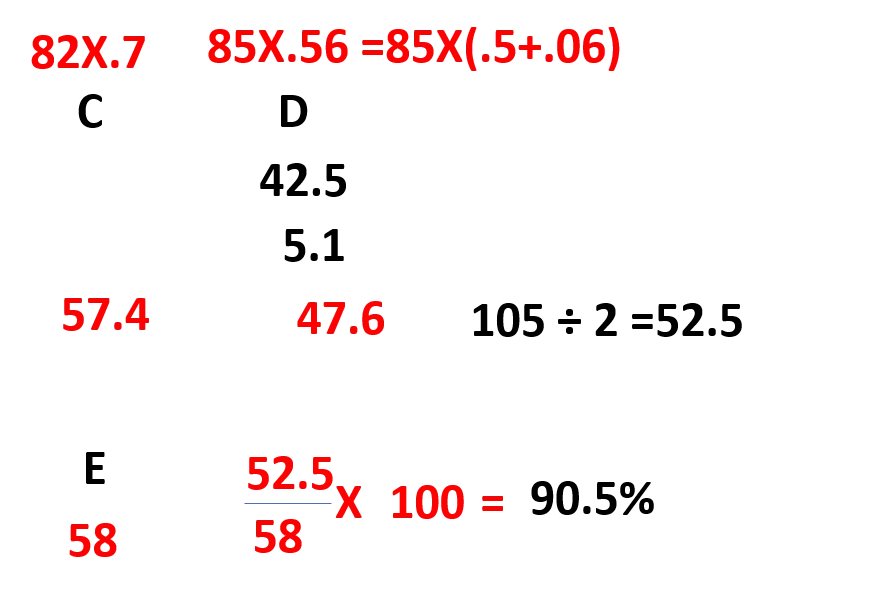
The average number of TV sets sold by companies C and D is what percentage of the number of TV sets manufactured by company E? Express your answer correct to one place of decimal.
कंपनी C और D द्वारा बेचे गए टीवी सेटों की औसत संख्या, कंपनी E द्वारा निर्मित टीवी सेटों की संख्या का कितना प्रतिशत है? अपने उत्तर को दशमलव के एक स्थान तक सही व्यक्त करें।
SSC Cgl Tier-1 held on 20-4-22 Shift-2
Question-6 cgl tier-1 data interpretation
The pie chart shows the breakup of the total number of employees of a company working in different offices (A to E), in degrees. The total number of employees – 3600
पाई चार्ट विभिन्न कार्यालयों (A से E) में काम कर रहे एक कंपनी के कर्मचारियों की कुल संख्या को डिग्रियों में दिखाता है। कर्मचारियों की कुल संख्या – 3600
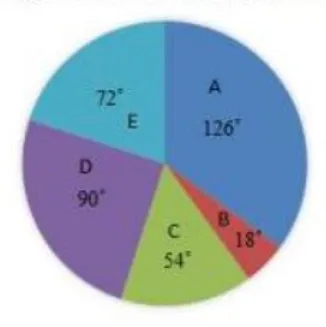
If the percentage of male employees in office C is 20% and that of female employees in office D is 40%, then what is the ratio of the number of female employees in office D to that of female employees in office C?
यदि कार्यालय C में पुरुष कर्मचारियों का प्रतिशत 20% है और कार्यालय D में महिला कर्मचारियों का प्रतिशत 40% है, तो कार्यालय D में महिला कर्मचारियों की संख्या का कार्यालय C में महिला कर्मचारियों की संख्या से अनुपात कितना है?
SSC Cgl Tier-1 held on 20-4-22 Shift-2
