
Data-Interpretation Cgl Question-13
Study the given bar graph and answer the question that follows. The bar graph shows theexports of cars of type A and B (in ₹ millions) from 2014 to 2018
दिए गए दंड आलेख का अध्ययन कीजिए और दिए गए प्रश्नों के उत्तर दीजिए। बार ग्राफ़ 2014 से 2018 तक A और B प्रकार की कारों का निर्यात (₹ करोड़ में) दिखाता है
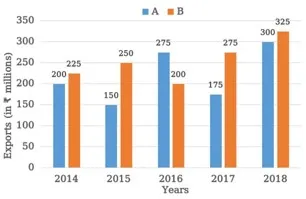
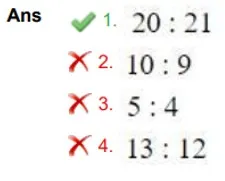
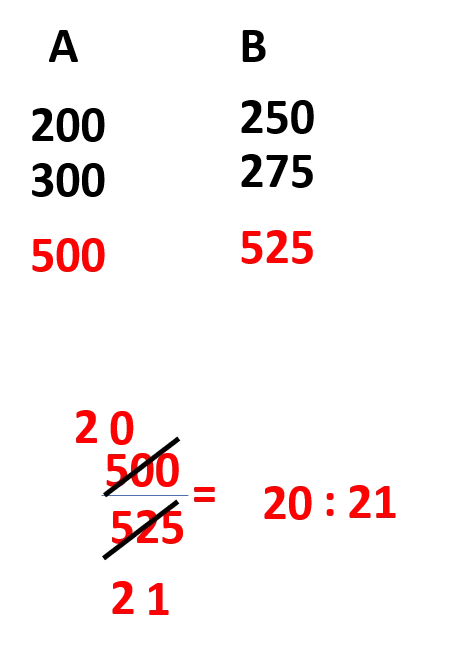
What is the ratio of the total exports of cars of type A in 2014 and 2018 to the total exports of cars of type B in 2015 and 2017?
2014 और 2018 में A प्रकार की कारों के कुल निर्यात का 2015 और 2017 में B प्रकार की कारों के कुल निर्यात से अनुपात कितना है?
SSC Cgl Tier-1 April 12,2022 Shift-1
Data-Interpretation Cgl Question-14
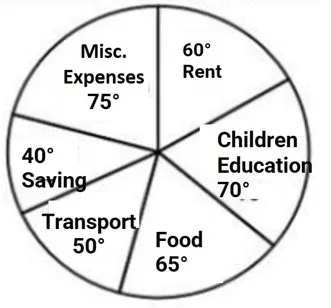
Monthly expenditure of a family on different heads is shown in the following pie chart. What is the percentage of family earnings spent on rent?
विभिन्न मदों पर एक परिवार का मासिक व्यय निम्नलिखित पाई चार्ट में दिखाया गया है। किराए पर खर्च की गई पारिवारिक आय का प्रतिशत कितना है?
Expenditure on different Heads Misc Expenses
SSC Cgl Tier-1 April 12,2022 Shift-1

Data-Interpretation Cgl Question-15
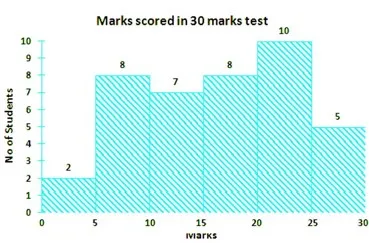
Q.10 The following histogram shows the marks scored by 40 students in a test of 30 marks. A student has to score a minimum of 10 marks to pass the test.
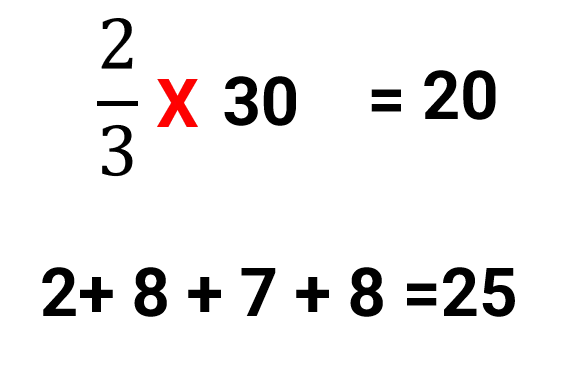
How many students have scored less than two-third of the total marks?
निम्नलिखित हिस्टोग्राम 30 अंकों की एक परीक्षा में 40 छात्रों द्वारा प्राप्त अंकों को दर्शाता है। एक छात्र को परीक्षा पास करने के लिए न्यूनतम 10 अंक प्राप्त करने होते हैं। कितने छात्रों ने कुल अंकों के दो-तिहाई से कम अंक प्राप्त किए हैं?
SSC Cgl Tier-1 April 12,2022 Shift-1
Data-Interpretation Cgl Question-16
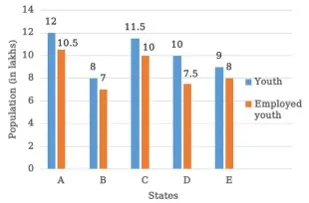
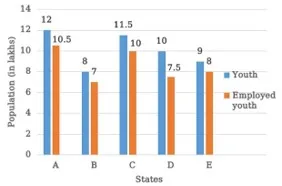
The following bar graph shows the number of youth (in lakhs) and the number of employed youth (in lakhs) in five states A, B, C, D and E.
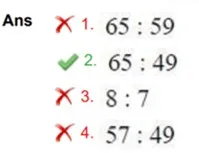
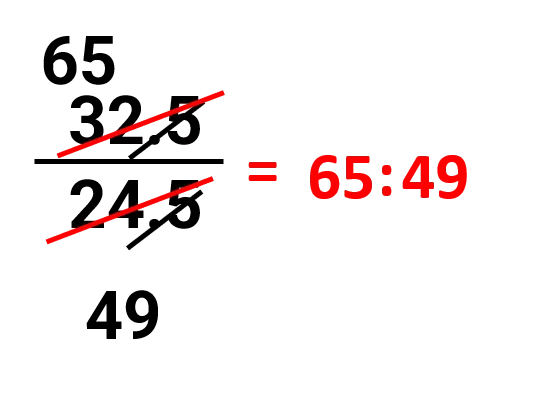
What is the ratio of the number of youth in state A, C and E taken together to the number of employed youth in states B, C and D taken together?
निम्नलिखित बार ग्राफ पांच राज्यों A, B ,C, D और ईE में युवाओं की संख्या (लाखों में) और नियोजित युवाओं की संख्या (लाखों में) दिखाता है। राज्य A, C और E में कुल मिलाकर युवाओं की संख्या का राज्यों B, C और D में मिलाकर नियोजित युवाओं की संख्या से अनुपात कितना है?
SSC Cgl Tier-1 April 12,2022 Shift-1
Data-Interpretation Cgl Question-17
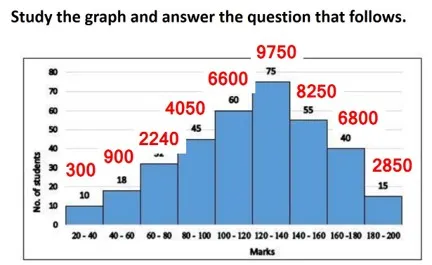
The given histogram represents the marks of students in Mathematics test of a certain class. The total number of students is 350 and the maximum marks of the test are 200. Study the graph and answer the question that follows.
दिया गया हिस्टोग्राम एक निश्चित कक्षा के गणित की परीक्षा में छात्रों के अंकों का प्रतिनिधित्व करता है। छात्रों की कुल संख्या 350 है और परीक्षा के अधिकतम अंक 200 हैं। ग्राफ का अध्ययन करें और नीचे दिए गए प्रश्न का उत्तर दें।
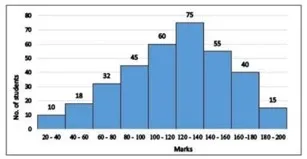
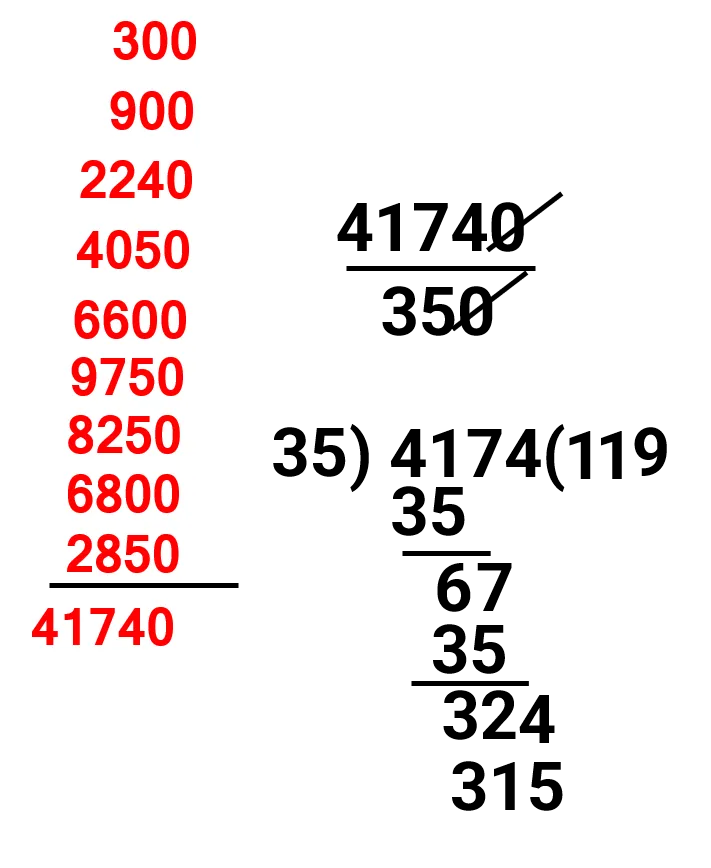
What is the class average (correct up to one place of decimal) of mathematics test?गणित की परीक्षा का वर्ग औसत (दशमलव के एक स्थान तक) क्या है?
SSC Cgl Tier-1 April 12,2022 Shift-2
Data-Interpretation Cgl Question-18
The following bar graph shows the number of youth (in lakhs) and the number of employed youth (in lakhs) in five states A, B, C, D and E.
In Which state(s) is the number of youth more than the average number of youth in the five states?
निम्नलिखित बार ग्राफ पांच राज्यों A, B, C, D और E.में युवाओं की संख्या (लाखों में) और नियोजित युवाओं की संख्या (लाखों में) दिखाता है। किस राज्य (राज्यों) में युवाओं की संख्या पाँच राज्यों में युवाओं की औसत संख्या से अधिक है?
SSC Cgl Tier-1 April 12,2022 Shift-2