Data Interpretation from Basic वीडियो के सहारे खुद से सीखने की एक प्रक्रिया है

Table of Contents
Types of Data Interpretation
अपने सुविधा के लिए सांख्यिकी अर्थात Data Interpretation को निम्न भागो में विभक्त कर सकते हैं जैसे
Tabular DI
Line Graph
Bar Graph
Pie Chart
Caselet Type
Data Interpretation on Bar Graph
The following graph shows the ratio of export to import of two companies A and B. Based on this information, answer these questions.
निम्नलिखित ग्राफ दो कंपनियों A और B के निर्यात और आयात के अनुपात को दर्शाता है। इस जानकारी के आधार पर, इन सवालों के जवाब दें।
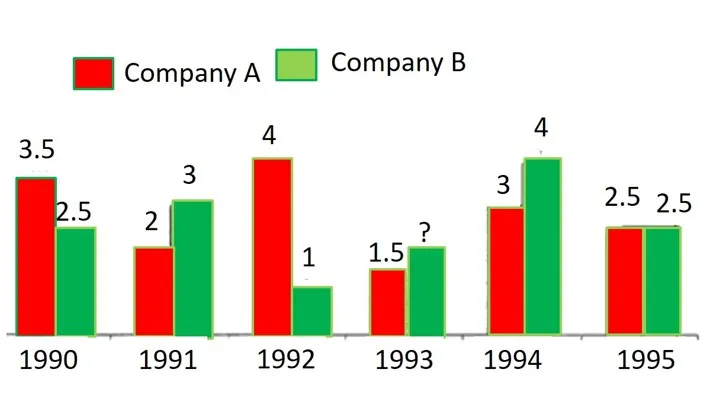
1.If in the year 1993 export of Company A is Rs 6 crores, what is the import of Company A in the same year?
यदि वर्ष 1993 में कंपनी A का निर्यात 6 करोड़ रुपये है, तो उसी वर्ष कंपनी A का आयात कितना है?
(1) Rs 4 crores
(2) Rs 2.75 crores
(3) Rs 4.5 crores
(4) Rs 4.25 crores
(5) None of these
2.If for Company B the total import is Rs 6 crores for the years 1990 and 4 crores 1991, what is the total export for these two years?
यदि कंपनी B के लिए वर्ष 1990 के लिए कुल आयात 6 करोड़ रुपये और 1991 में 4 करोड़ रुपये है, तो इन दो वर्षों में कुल निर्यात कितना है?
(1) Rs 15 crores
(2) Rs 30 crores
(3) Rs 16 crores
(4) Can’t say
(5) None of these
3.If in the year 1991 the imports of Company A and Company B are Rs 3 crores and Rs 4 crores respectively, what is the ratio of their exports in the same year?
यदि वर्ष 1991 में कंपनी A और कंपनी B का आयात क्रमशः 3 करोड़ रुपये और 4 करोड़ रुपये है, तो उसी वर्ष उनके निर्यात का अनुपात क्या है?
(1) 1 : 1
(2) 2 : 3
(3) 1 : 2
(4) Can’t say
(5) None of these
4.What is the percentage increase in the ratio of export to import for Company A from the year 1990 to 1991?
वर्ष 1990 से 1991 तक कंपनी A के लिए निर्यात और आयात के अनुपात में प्रतिशत वृद्धि कितनी है?
(1) 5%
(2) 50%
(3) 25%
(4) 20%
(5) None of these
5.In which of the following years was the ratio of the difference between export and import of Company B the maximum?
निम्नलिखित में से किस वर्ष में कंपनी B के निर्यात और आयात के बीच अंतर का अनुपात अधिकतम था?
(1) 1990
(2) 1991
(3) 1992
(4) 1994
(5) Data inadequate
D.I. 6-10
The bar graph given below shows the sales of books (in thousand number) from six branches of a publishing company during two consecutive years 2000 and 2001.
Sales of Books (in thousand numbers) from Six Branches – B1, B2, B3, B4, B5 and B6 of a publishing Company in 2000 and 2001.
नीचे दिया गया बार ग्राफ लगातार दो वर्षों 2000 और 2001 के दौरान एक प्रकाशन कंपनी की छह शाखाओं से पुस्तकों की बिक्री (हजार संख्या में) दर्शाता है।

2000 और 2001 में एक प्रकाशन कंपनी की छह शाखाओं - B1, B2, B3, B4, B5 और B6 से पुस्तकों की बिक्री (हजार संख्या में)।
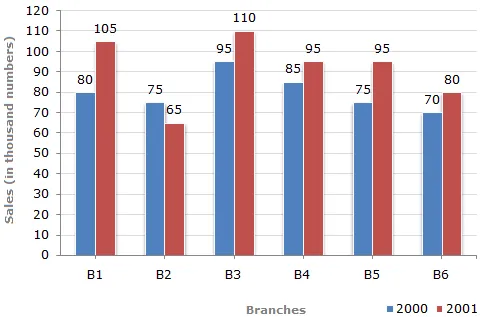
6) What is the ratio of the total sales of branch B2 for both years to the total sales of branch B4 for both years?
दोनों वर्षों के लिए शाखा B2 की कुल बिक्री का दोनों वर्षों के लिए शाखा B4 की कुल बिक्री से अनुपात कितना है?
7)Total sales of branch B6 for both the years is what percent of the total sales of branches B3 for both the years?
दोनों वर्षों के लिए शाखा B6 की कुल बिक्री, दोनों वर्षों के लिए शाखाओं B3 की कुल बिक्री का कितना प्रतिशत है?
8)What percent of the average sales of branches B1, B2 and B3 in 2001 is the average sales of branches B1, B3 and B6 in 2000?
2001 में शाखाओं B1, B2 और B3 की औसत बिक्री का कितना प्रतिशत 2000 में शाखाओं B1, B3 और B6 की औसत बिक्री है?
9) What is the average sales of all the branches (in thousand numbers) for the year 2000?
वर्ष 2000 के लिए सभी शाखाओं की औसत बिक्री (हजारों की संख्या में) कितनी है?
10) Total sales of branches B1, B3 and B5 together for both the years (in thousand numbers) is?
दोनों वर्षों में शाखाओं B1, B3 और B5 की मिलाकर कुल बिक्री (हजारों में) कितनी है?
D.I. 11 to 15
The following bar graph shows the Income and Expenditures (in million US $) of five companies in the year 2001. The percent profit or loss of a company is given by
निम्नलिखित बार ग्राफ वर्ष 2001 में पांच कंपनियों की आय और व्यय (मिलियन यूएस डॉलर में) दिखाता है। कंपनी का प्रतिशत लाभ या हानि द्वारा दिया जाता है

Income and Expenditure (in million US $) of five companies in the year 2001.वर्ष 2001 में पांच कंपनियों की आय और व्यय (मिलियन यूएस डॉलर में)।
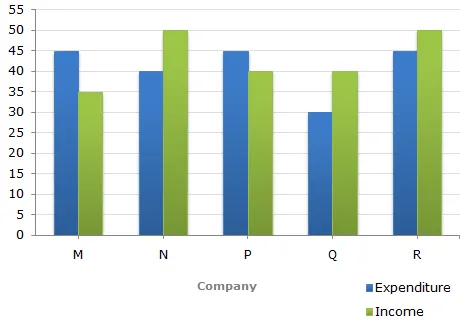
11) The companies M and N together had a percentage of profit/loss of?
कंपनियों M और N का मिलाकर लाभ/हानि का प्रतिशत कितना था?
12) In 2001, what was the approximate percentage of profit/loss of all the five Companies taken together?
2001 में, सभी पांच कंपनियों को मिलाकर लाभ/हानि का अनुमानित प्रतिशत कितना था?
13) Which company earned the maximum percentage profit in the year 2001?
किस कंपनी ने वर्ष 2001 में अधिकतम प्रतिशत लाभ अर्जित किया?
14) For Company R, if the expenditure had increased by 20% in year 2001 from year 2000 and the company had earned profit of 10% in 2000, what was the Company’s income in 2000 (in million US $)?
कंपनी R के लिए, यदि वर्ष 2000 से वर्ष 2001 में व्यय में 20% की वृद्धि हुई थी और कंपनी ने 2000 में 10% का लाभ अर्जित किया था, तो वर्ष 2000 में कंपनी की आय (मिलियन यूएस डॉलर में) क्या थी?
15) If the income of Company Q in 2001 was 10% more than its income in 2000 and the Company had earned a profit of 20% in 2000, then its expenditure in 2000 (in million US $) was?
यदि 2001 में कंपनी Q की आय 2000 में उसकी आय से 10% अधिक थी और कंपनी ने 2000 में 20% का लाभ अर्जित किया था, तो 2000 में इसका व्यय (मिलियन यूएस डॉलर में) कितना था?
D.I. 16 to 20
The bar graph given below shows the percentage distribution of the total production of a car manufacturing company into various models over two years.
Percentage of Six different types of Cars manufactured by a Company over Two Years
नीचे दिया गया बार ग्राफ दो वर्षों में विभिन्न मॉडलों में एक कार निर्माण कंपनी के कुल उत्पादन के प्रतिशत वितरण को दर्शाता है।
दो वर्षों में एक कंपनी द्वारा निर्मित छह विभिन्न प्रकार की कारों का प्रतिशत
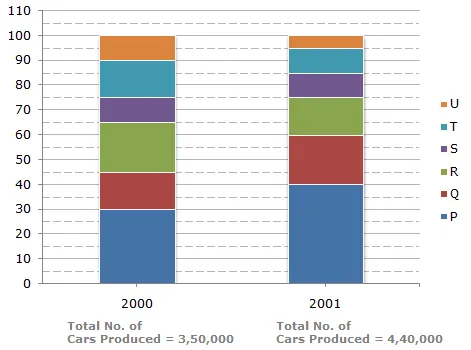
16) What was the difference in the number of Q type cars produced in 2000 and that produced in 2001?
2000 में उत्पादित Q प्रकार की कारों और 2001 में उत्पादित कारों की संख्या में कितना अंतर था?
17) Total number of cars of models P, Q and T manufactured in 2000 is?
वर्ष 2000 में निर्मित मॉडल P, Q और T की कारों की कुल संख्या कितनी है?
18) If the percentage production of P type cars in 2001 was the same as that in 2000, then the number of P type cars produced in 2001 would have been?
यदि 2001 में P प्रकार की कारों का उत्पादन प्रतिशत 2000 के समान था, तो 2001 में उत्पादित P प्रकार की कारों की संख्या कितनी होगी?
19) If 85% of the S type cars produced in each year were sold by the company, how many S type cars remain unsold?
यदि प्रत्येक वर्ष उत्पादित S प्रकार की कारों में से 85% कंपनी द्वारा बेची जाती हैं, तो S प्रकार की कितनी कारें बिना बिके रह जाती हैं?
20) For which model the percentage rise/fall in production from 2000 to 2001 was minimum?
किस मॉडल के लिए 2000 से 2001 तक उत्पादन में प्रतिशत वृद्धि/गिरावट न्यूनतम थी?