Types of Data Interpretation
अपने सुविधा के लिए सांख्यिकी अर्थात Data Interpretation को निम्न भागो में विभक्त कर सकते हैं जैसे
Tabular DI
Line Graph
Bar Graph
Pie Chart
Caselet Type
Data Interpretation on Bar Graph
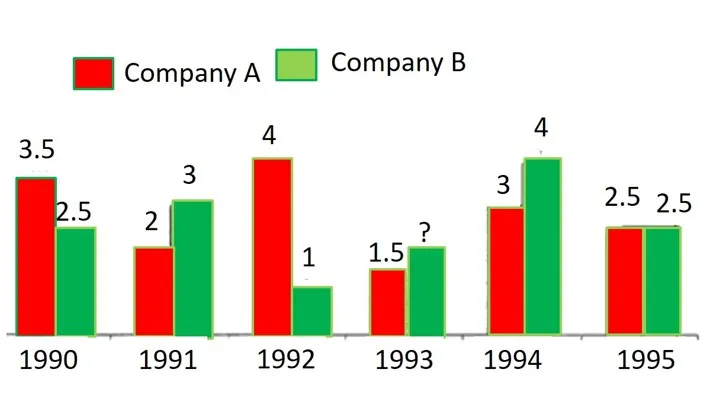
The following graph shows the ratio of export to import of two companies A and B. Based on this information, answer these questions.
निम्नलिखित ग्राफ दो कंपनियों A और B के निर्यात और आयात के अनुपात को दर्शाता है। इस जानकारी के आधार पर, इन सवालों के जवाब दें।
1.If in the year 1993 export of Company A is Rs 6 crores, what is the import of Company A in the same year?
यदि वर्ष 1993 में कंपनी A का निर्यात 6 करोड़ रुपये है, तो उसी वर्ष कंपनी A का आयात कितना है?
(1) Rs 4 crores
(2) Rs 2.75 crores
(3) Rs 4.5 crores
(4) Rs 4.25 crores
(5) None of these
2.If for Company B the total import is Rs 6 crores for the years 1990 and 4 crores 1991, what is the total export for these two years?
यदि कंपनी B के लिए वर्ष 1990 के लिए कुल आयात 6 करोड़ रुपये और 1991 में 4 करोड़ रुपये है, तो इन दो वर्षों में कुल निर्यात कितना है?
(1) Rs 15 crores
(2) Rs 30 crores
(3) Rs 16 crores
(4) Can’t say
(5) None of these
3.If in the year 1991 the imports of Company A and Company B are Rs 3 crores and Rs 4 crores respectively, what is the ratio of their exports in the same year?
यदि वर्ष 1991 में कंपनी A और कंपनी B का आयात क्रमशः 3 करोड़ रुपये और 4 करोड़ रुपये है, तो उसी वर्ष उनके निर्यात का अनुपात क्या है?
(1) 1 : 1
(2) 2 : 3
(3) 1 : 2
(4) Can’t say
(5) None of these
4.What is the percentage increase in the ratio of export to import for Company A from the year 1990 to 1991?
वर्ष 1990 से 1991 तक कंपनी A के लिए निर्यात और आयात के अनुपात में प्रतिशत वृद्धि कितनी है?
(1) 5%
(2) 50%
(3) 25%
(4) 20%
(5) None of these
5.In which of the following years was the ratio of the difference between export and import of Company B the maximum?
निम्नलिखित में से किस वर्ष में कंपनी B के निर्यात और आयात के बीच अंतर का अनुपात अधिकतम था?
(1) 1990
(2) 1991
(3) 1992
(4) 1994
(5) Data inadequate